TensorFlow can create more advanced graphs. A graph doesn’t have to be just 3 nodes.
You can create large graphs and graphs with subgraphs. You can visualize this with TensorBoard.
Related Course:
Deep Learning with TensorFlow 2 and Keras
Graph
In tensorflow we define graphs. These graphs show the operations in the session. The example below creates a graph with more nodes:
import tensorflow as tf |
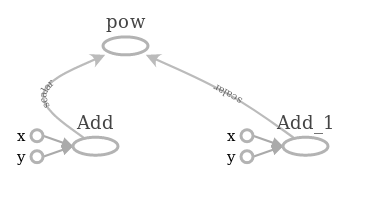
Save it and run it with Python. Then open it with TensorBoard and this graph should show up:
Subgraphs
Subgraphs are also possible, you could have something like:
op1 = tf.add(x,y) |
A subgraph is possible to break into chunks, each can be run on a different CPU or GPU.
Can you make more than one graph?
You can build more than one graph, but that doesn’t work distributed.
The session runs the default graph. You should have disconnected subgraphs in a graph.