A decision tree can be visualized. A decision tree is one of the many Machine Learning algorithms.
It’s used as classifier: given input data, it is class A or class B? In this lecture we will visualize a decision tree using the Python module pydotplus and the module graphviz
If you want to do decision tree analysis, to understand the decision tree algorithm / model or if you just need a decision tree maker - you’ll need to visualize the decision tree.
Related course: Complete Machine Learning Course with Python
Decision Tree
Install
You need to install pydotplus and graphviz. These can be installed with your package manager and pip.
Graphviz is a tool for drawing graphics using dot files. Pydotplus is a module to Graphviz’s Dot language.
Data Collection
We start by defining the code and data collection. Let’s make the decision tree on man or woman. Given input features: “height, hair length and voice pitch” it will predict if its a man or woman.
We start with the training data: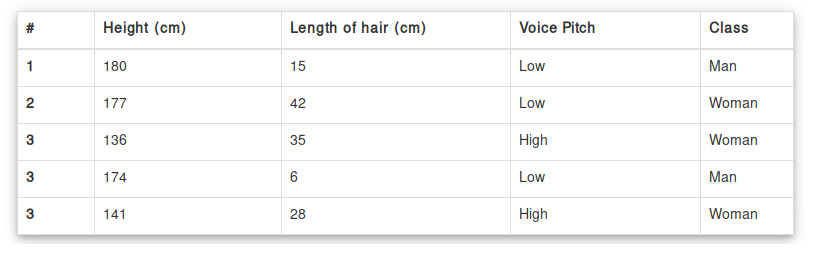
In code that looks like:import pydotplus
from sklearn.datasets import load_iris
from sklearn import tree
import collections
# Data Collection
X = [ [180, 15,0],
[177, 42,0],
[136, 35,1],
[174, 65,0],
[141, 28,1]]
Y = ['man', 'woman', 'woman', 'man', 'woman']
data_feature_names = [ 'height', 'hair length', 'voice pitch' ]
Train Classifier
The next step is to train the classifier (decision tree) with the training data.
Training is always necessary for supervised learning algorithms# Training
clf = tree.DecisionTreeClassifier()
clf = clf.fit(X,Y)
If you are new to Machine Learning, I highly recommend this book
Decision Tree Visualization
We then visualize the tree using this complete code:
# Visualize data |
This will save the visualization to the image tree.png, which looks like this:
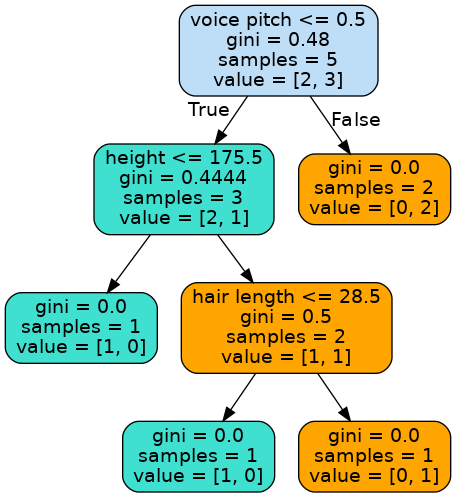
If you want to make predictions, check out the decision tree article.