
K-means takes a list of numbers and sorts them into k groups. The groups are not something you give it, the algorithm works them out on its own. That makes it an unsupervised learning task, nothing in the data tells the algorithm what the answer is.
You can cluster it automatically with the kmeans algorithm.
In the kmeans algorithm, k is the number of clusters.
kmeans data
We always start with data. This is our observed data, simply a list of values.
We plot all of the observed data in a scatter plot.
# clustering dataset |
Result: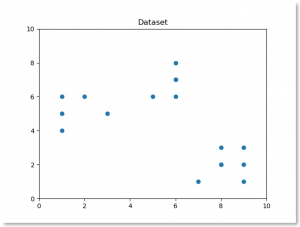
kmeans clustering example
We will cluster the observations automatically.
K can be determined using the elbow method, but in this example we’ll set K ourselves.
k-means puts every observation in the group with the nearest centroid. Then it moves each centroid to the middle of its group and does it again.
Each observation belong to the cluster with the nearest mean.
# clustering dataset |
Result: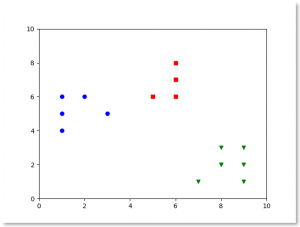
If you see the above result, Kmeans has clustered the observations automatically.
What happens inside
- Pick k starting points at random. These are the first centroids.
- Every observation goes to the centroid closest to it.
- Move each centroid to the average of the points assigned to it.
- Repeat the last two steps until the centroids stop moving.
In scikit-learn that is KMeans(n_clusters=k) followed by
fit() and predict(). The result is in
kmeans.labels_ and the centres are in kmeans.cluster_centers_.
K-means assumes clusters that are roughly round and about the same size. Points far from the others pull their centroid away, and a very different spread in one cluster does not get a proper centroid of its own. You have to set k yourself, the elbow method helps.
Want more practice on this? Practise this on PyChallenge, there are short browser exercises you can run right after reading.