
Find k for kmeans using the elbow method?
k-means needs a number before it starts: how many clusters should it look for? The elbow method gives you an answer without guessing.
You fit the model several times, with a different k each time, and plot how good the fit gets.
The KMeans algorithm can cluster observed data. But how many clusters (k) are there?
Determine optimal k
The technique to determine K, the number of clusters, is called the elbow method.
With a bit of fantasy, you can see an elbow in the chart below.
We’ll plot:
- values for K on the horizontal axis
- the distortion on the Y axis (the values calculated with the cost function).
This results in:
When K increases, the centroids are closer to the clusters centroids.
The improvements will decline, at some point rapidly, creating the elbow shape.
That point is the optimal value for K. In the image above, K=3.
Elbow method example
The example code below creates finds the optimal value for k. # clustering dataset
# determine k using elbow method
from sklearn.cluster import KMeans
from sklearn import metrics
from scipy.spatial.distance import cdist
import numpy as np
import matplotlib.pyplot as plt
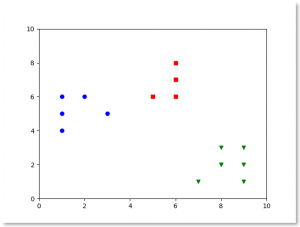
x1 = np.array([3, 1, 1, 2, 1, 6, 6, 6, 5, 6, 7, 8, 9, 8, 9, 9, 8])
x2 = np.array([5, 4, 5, 6, 5, 8, 6, 7, 6, 7, 1, 2, 1, 2, 3, 2, 3])
plt.plot()
plt.xlim([0, 10])
plt.ylim([0, 10])
plt.title('Dataset')
plt.scatter(x1, x2)
plt.show()
# create new plot and data
plt.plot()
X = np.array(list(zip(x1, x2))).reshape(len(x1), 2)
colors = ['b', 'g', 'r']
markers = ['o', 'v', 's']
# k means determine k
distortions = []
K = range(1,10)
for k in K:
kmeanModel = KMeans(n_clusters=k).fit(X)
kmeanModel.fit(X)
distortions.append(sum(np.min(cdist(X, kmeanModel.cluster_centers_, 'euclidean'), axis=1)) / X.shape[0])
# Plot the elbow
plt.plot(K, distortions, 'bx-')
plt.xlabel('k')
plt.ylabel('Distortion')
plt.title('The Elbow Method showing the optimal k')
plt.show()
Reading the chart
- The horizontal axis is k, from 1 up to whatever you decide to try.
- The vertical axis is the distortion, also called inertia. scikit-learn puts it in
kmeans.inertia_. - With one cluster the error is big, so the curve starts high.
- Every extra cluster lowers the error, but the drop gets smaller each time.
- Where the curve flattens out is the elbow, and that k is your answer.
You can compute it in code with kmeans.inertia_ in a loop and look for
the biggest drop. With a clear elbow the chart is enough.
Reading helps, writing fixes it. PyChallenge has exercises on this and you can try them right now.
How is the calculated distortion different from kmeanModel.inertia_ ? Thank you!