
Using the numpy library you can get various statistical values in Python. NumPy (Numerical Python) is a module consisting of multidimensional array objects and a collection of routines for processing those arrays.
SQL is the language you use to ask a database questions. If you want to get better at it, SQLCrab runs real queries in the browser, nothing to install.
The statistics module is part of the standard library, so it is always
there. You do not need to know any advanced maths to use it.
On this page you learn how to apply statistical functions to a Python list. You don’t need advanced statistics knowledge to follow along.
Five number summary
The five number summary is a set of functions in statistics that tell something about a data set. This includes the minimum, the maximum, the standard deviation, the mean and the median.
Import the numpy module.
import numpy |
You can optionally import the math module. Then create a list of numbers. In this example the list is defined manually, but of course you can load a list of numbers from excel, from a text file or another data source.
import numpy |
We can get the five number summary using the math library.
The five number summary contains: minimum, maximum, median, mean and the standard deviation.
All of these functions are implemented in the numpy module, you can either output them to the screen or store them in a variable.
|
The example program outputs the five number summary for the given list.
import math |
Boxplot
In statistics, a box plot or boxplot is a method to graphically show groups of numerical data through their quartiles.
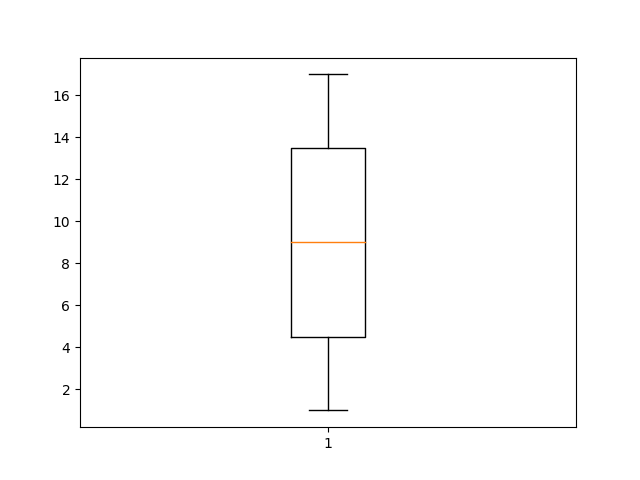
Matplotlib has all kinds of plots. One of them being a function to create a boxplot. This code will create a boxplot:import matplotlib.pyplot as plt
import numpy as np
x = [1,2,15,3,6,17,8,16,8,3,10,12,16,12,9]
plt.boxplot(x)
plt.show()
The numbers you get
mean(data)the average.median(data)the middle value, sorted first. With an even count it is the average of the two middle values.mode(data)the value that appears most.stdev(data)the standard deviation, how spread out the values are.variance(data)the square of that.
The five number summary is count, min, first quartile, median, third quartile and max.
You can get each one with statistics.quantiles(data, n=4).
The mean follows the data, the median does not. With one huge value in the list the mean jumps and the median stays where it was, which is why both are worth looking at.
Reading helps, writing fixes it. PyChallenge has exercises on this and you can try them right now.
Hi Andre, install the module matplotlib using pip. http://matplotlib.org/
Excuse me, whats the meaning of the plot? why that shape like a piston?
plot is a module that contains graphical functions. We call boxplot() which creates that particular shape.
Have a look at http://matplotlib.org/ for more graphics
I am newbie and I am using windows 32, I got the error below
You are missing the module 'numpy'. http://www.scipy.org/install.html
There are unofficial window binaries for the numpy module: http://www.lfd.uci.edu/~gohlke/pythonlibs/